Infrastructure
- CA working to hit 33% renewable (through RPS) by 2020, currently on track. Next goal is 50%, which will require infrastructure upgrades: "The CPUC does not currently observe any clear signals that California’s present trajectory toward 33% renewables has created unexpected and unmanageable reliability issues. However, in thinking about a renewables future beyond 33%, there are three emerging reliability “signposts” that point to the need to increase system flexibility and address grid integration in new ways ... these three signposts are ramping ability, over-generation, and the need for ancillary services." CPUC, vii
- Past century's grid paradigm: ensure reliability & universal access based on presumption of cheap baseload & dispatchable power. Plan to meet expected load with load following plants & peaker plants. New paradigm creates reliability concerns that are harder to model & predict because they involve more factors CPUC, 4
- Renewables-related concerns for California utilities: ramping, over-generation, and ancillary services– as well as meeting peak load. New concerns generally caused by glut of solar and point to a need for flexibility to respond to variability in renewable energy sources as currently deployed CPUC, 5
- Oversupply can be mitigated with curtailment, or might lead to an overgeneration event (reducing grid reliability) CPUC, 11
- A negative market price indicates an oversupply. If it's local, it's due to congestion; if it's system-wide, it's an excess of generation feeding in CPUC, 12
- In theory, a negative market price is a strong economic incentive for generators to implement curtailment CPUC, 12
- Wind and solar might continue to generate despite a negative market price because of production incentives (e.g. tax credits) or long-term contracts. They are also the last to be economically curtailed, as they usually have the lowest bid price CPUC, 12
- Many baseload energy generation resources have long-term contracts, which reduces grid flexibility as renewables come online CPUC, 11
- The utilities have sophisticated modeling algorithms for wind, irradiance on solar, and temperature (impacts demand), but our ability to predict the weather (in general) is not very good, which makes grid deployment planning inaccurate CPUC, 12
- CAISO decreased manual curtailment (in favor of economic curtailment) in 2014 by lowering the bid floor for negative market pricing and encouraging economic response from solar and wind (how?) CPUC, 13
- Total curtailment of CAISO in 2014 was ~36 GWh but is projected to 400-900 GWh in 2024 if RPS increased to 40% with no other policy changes CPUC, 14
- High curtailment could lead to increased rates because of long-term purchase contracts between grid and generators– costs of unused electricity will be passed along CPUC, 14
- Curtailment makes planning (for both renewable and nonrenewable generators) unreliable because generators can be mandated to stop generating and thus stop receiving income CPUC, 14
- So far, economic curtailment is an ok solution to oversupply problems (encourages generators to match load profiles) but can become problematic if increased due to baseload generation contracts and reduced use of renewable resources (which is the point of RPS) CPUC, 14
- Curtailment issues due to high solar generation may be unique to California; Germany for example has some curtailment of wind, but overall not much curtailment CPUC, 14
- In the United States, 72.2% of electricity was served by shareholder-owned companies (14.1% public, 11.8% cooperatives, 1.9% energy service providers) EEI, 27
- United States' energy structure is at an inflection point driven by: 1) new power generation and transmission technologies are becoming commercially viable. Key factors are solar & wind, responsive rather than static grid structure, and fracking driving down cost of natural gas. 2) utilities are encountering competition, unfamiliar due to usual ownership of vertical monopoly (plants, transmission, and distribution). New legislation transitions towards price per performance, market-based economics generally even though power is not naturally a commodity (hard to store etc.) 3) society is pushing for cleaner energy (driven by health, economic, and climate change concerns), which has led to policy at state and local levels [Aggarwal, 4-5][Aggarwal]
- The American Society of Civil Engineers rated America's infrastructure a D+ in its quadrennial (2013) report, saying the nation needs to rebuild the grid completely by 2050 [Aggarwal, 8][Aggarwal]
- Five basic roles in power system management: generation, transmission, distribution, demand-side management & customer service, system optimization [Aggarwal, 9-10][Aggarwal]
Physical characteristics
Use of electricity
- Advantages: easy to measure and control, can be used for many purposes, can be generated from many sources, has high thermodynamic quality (high efficiency of conversion into mechanical or thermal energy), relatively low-loss in transmission and distribution Hug, 1
- Disadvantages: high voltages are dangerous to humans, storage is inefficient Hug, 1
- Complete collapse of an electrical system can take 24h or more to restore. "The social and economic consequences of such a system-wide blackout are so severe that no sensible government would agree to the implementation of a market mechanism that significantly increases the likelihood of such an event." [Kirschen, 50][Kirschen ]
Basic concept of the Grid
- Generators produce electricity, typically in large plants of varying types (hydro, gas, wind, etc.). Electricity is step-up transformed to be transported over high voltage transmission lines, then step-down transformed closer to the destination for distribution to end users Hug, 8
- Most of the system is in AC Hug, 8
- High voltage lines are operated in the 230,000-750,000V range at low current, which keeps losses due to conductor heating low Hug, 8
- Grid can be vertically integrated, or have one or various parts privately and independently controlled (with transco, genco, disco, coexisting with or existing independently from vertically integrated utilities, moderated by ISO and/or other MO). In the United States, privatization for competition is part of a deregulation/anti-monopoly trend begun in the 1980's Kirschen, 3
- Large consumers can participate actively in the electricity market, sometimes bidding in timing of their high-load periods to change the shape of the grid, sometimes directly connected to transmission lines for wholesale energy purchase Kirschen, 4
System components
Generator basics
- A "prime mover" is the part of the generator that converts an energy source (like steam, water, wind) into mechanical energy
- An electrical generator works by electromagnetic induction– a conductor moves in a magnetic field (or vice versa, usually the magnetic field is easier to move in a generator)
- A magnetic field is created in the rotor: field windings around an iron core are supplied with DC current (the excitation current), generating a magnetic field. The stator is wrapped with primary (or armature) windings of a conductor (wire) – three in the case of a three-phase generator.
- Electric current is induced in the conductor proportional to the motion. This also causes back EMF, resisting the motion and requiring more force to move
- Generators connected to the grid all run with the same frequency. Depending on phase, they might move at different speeds (the most common type on the grid is three-phase)
- Because generators on the grid have to be all the same frequency, input energy has to increase to counteract EMF as electrical load on the system increases. Imagine a
- The frequency of a synchronous generator is F=PN/120 where P is the number of poles and N is the speed of the generator in RPM
- Because of conservation of energy, if the electric load delivered increases, kinetic energy on the turbines decreases and vice versa– so if frequency is not adjusted, a sudden drop in load can cause turbines to begin spinning extremely quickly. This is why frequency control is important Graves, 3-2
Transmission lines
Key electrical properties of transmission lines, from Graves, 3-9 - 3-10:
| Property | Definition | Considerations |
|---|---|---|
| inductance | magnetic field associated with current in the line, varying as voltage varies | induces EMF in neighboring transmission lines and between strands in the same line, creating a need for reactive power in the line and causing voltage drop near the receiving end of the line |
| capacitance | because lines are conductors insulated from one another, adjacent lines are functionally a capacitor | some of the flow of the current diverts and adjusts the electrostatic charge between the lines as the voltage varies, serving the inductor ned for reactive power |
| shunt conductance | flow of current between theoretically disconnected lines, which can happen if the electrical field is stronger than the insulative property of air | typically this is very minor and not accounted for in planning |
- High power transmission lines (overhead lines) are typically made of many-stranded aluminum (or rarely copper) wound around steel (for strength and flexibility). Often 60+ strands, several thousand pounds per mile. Insulator is the air around them Graves, 3-9
- Insulated cables and GIL are typically used in population-dense areas as the power circuits can be much more dense Hug, 7
- High-voltage transmission is less lossy than low-voltage transmission. This is because loss is proportional to current squared, and high-voltage lines have been step-up transformed (reducing current per Ohm's law)
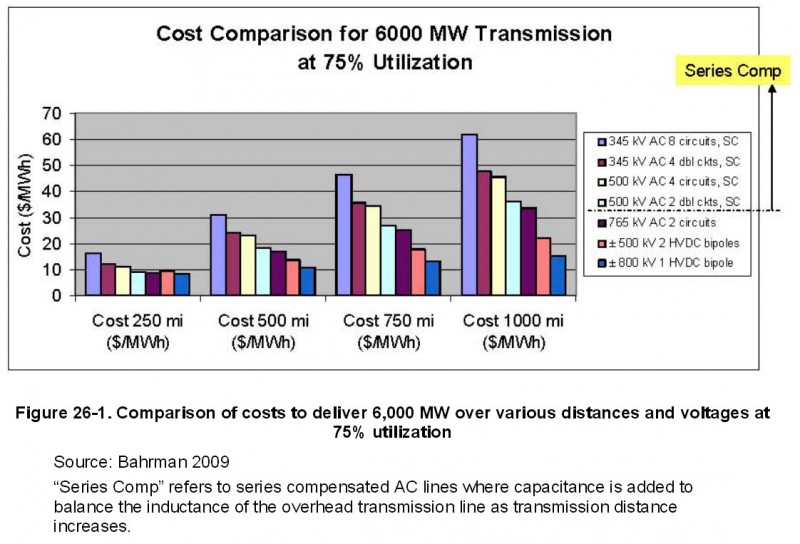 Cost of transmission lines by type & voltage Naam
Trade mechanisms
Electricity and ancillary service sales clear on different timescales:
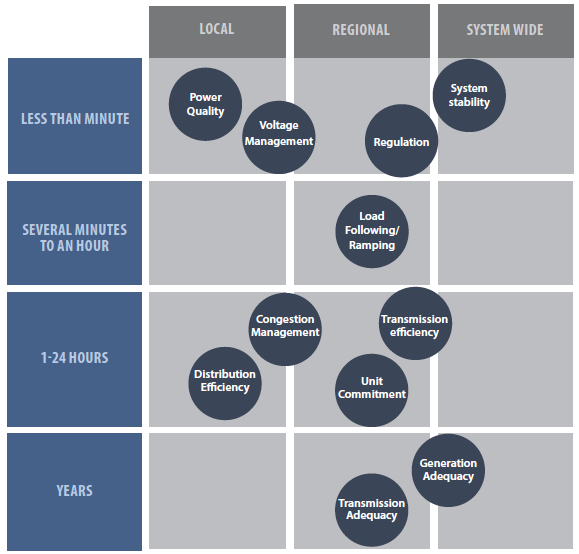 [Aggarwal, 16][Aggarwal]
- Electricity is commodified through a "managed spot market" Kirschen, ch 3
- The idea is to create a pool market which encourages generators to bid based on realistic marginal cost, used to create a supply curve, while demand curve is often generated by load forecasting. The two curves are overlaid to find the intersection, which is used as a "system marginal price" (SMP) or "clearing price", which is the price at which all generators who bid at or below SMP will be paid. Kirschen, ch 3
- In "managed spot market", "managed" refers to the fact that the market is typically balanced by a system operator (SO, often an ISO). The SO makes up for the fact that electricity is not a true commodity (its value is much more time-dependent than other markets) by executing gate closure for the various markets Kirschen, ch 3
- Gate closure is staggered in order to accommodate varied stakeholder needs: for ideal market dynamics, the system would be real-time. For a large generator plant that needs to start up, half an hour early is too tight. Forecast is more accurate closer to real time. Kirschen, ch 3
- Low elasticity of demand (% change in price causes a smaller % change in demand) from consumers facilitates the exercise of market power by the producers Kirschen, 75
- Energy retailer buys at fluctuating wholesale prices and sells at tariff prices to small consumers to insulate them from changing spot market prices/provide price reliability. In order to do this, it is of great value to them to accurately forecast expected demand, to set an appropriate tariff that is competitive with other options [? do we have those?] but above the average cost of energy used over the period Kirschen, 76 Question: How good are these models?
- Electrical transmission is difficult to price fairly because electricity follows physical laws (Kirchhoff's Laws) instead of economically convenient laws (e.g. it would be more economically convenient if electricity only flowed through a paid-for line instead of all interconnected lines)
- Nodal marginal pricing (nodal pricing) is an attempt to account for transmission costs, valuing electrical energy at each point of interconnection. However, inefficiencies in the system (congestion, etc.) can lead to inefficient pricing where the market shows negative prices at nodes (electricity flows from a high price area to a lower-price area) Kirschen, 175
- Electricity is a fairly price-inelastic commodity, so imbalances in supply and demand tend to lead to price spiking. Price spikes are not politically feasible because their causes are hard to explain to an average consumer (who may not be able to quickly curtail usage in response to rising price), and because electricity is used for essential functions (e.g. cooking, heating) and so it might not be supportable to cut back on usage in response to price. To avoid this problem, many electricity markets institute a price cap. In turn, this reduces incentive to invest in new generation capacity Kirschen, 219-220
- Electricity generation capacity construction tends to follow a boom/bust cycle, possibly due to the delay between market demand (high electricity prices) and capacity availability(permitting and construction) Kirschen, 220
Capacity markets
- Concept of a capacity market: grid operators invest in capacity rather than generation, several years ahead of generation, to stabilize pricing. For example, PJM market has an annual auction for power to be produced three years in the future ("Base Residual Auction") then generators (and demand response resources) participate in balancing auctions annually to buy/sell commitments ("Incremental Auctions") in case of incorrect initial capacity estimation James
- Generators are intended to bid in at the cost of operation (//How is this enforced? Here is a great discussion from the Yale Journal on Regulation on ways this kind of thing gets abused) James
Reliability
| Term | Meaning in the electric grid context | Moderated by |
|---|---|---|
| reliability | ability to withstand unplanned disturbances, measured as % likelihood to not lose power, particularly in the event of generator failure | having redundant generation and transmission resources, can be by interconnection with adjacent utility |
| stability | ability for generators to remain synchronized across changes in system status | operating generators well within capacity limits |
| security | ability of the system to sustain changes in power flow | operating transmission resources below their theoretical capacity |
- Modern grid has 99.97% energy availability reliability in the United States EPRI, 9
- A system supplied by a few large generating units need more reserve than one with many small generating units. It follows that a system based on fewer, larger plants has higher operating costs, which are passed on to the consumer Kirschen, 130
- A study in 2000 showed that industrial consumers account for 93% of the analyzed power system's regulation and 58% of its load following even though they represented only 34% of its total load. Since charges are based on consumption, this means residential customers end up subsidizing the expensive needs of industrial customers. Within industrial, there is also wide variance of this type of need Kirschen, 130
Electrical characteristics and losses
- Three types of losses are encountered in a power system: variable losses, fixed losses, and nontechnical losses Kirschen, 175-176
- A detailed engineering introduction to the electrical dynamics of the grid can be found in Hiskens
- High-power transmission lines loses a few hundredths of an ohm per thousand feet Graves, 3-9
- The United States has very few HVDC lines. "The cost of high voltage DC (HVDC) transmission lines is roughly 1 cents per kwh for 500 miles, or 1.5 cents per kwh for 1,000 miles transmitted. Over 1,000 miles, an HVDC line may lose 5% or so of the electricity it transmits." Naam
- U.S. grid loses about 7% of its energy in transmission from generation to end use Muller, 166
Challenges in grid transmission
- "If these gaps between generation and load were to be treated as imbalances between supply and demand and corrected using an open market mechanism, producers and consumers would have to be kept informed of the state of the market (offer, demand, prices) on a second-by-second basis. A sufficiently large number of them would have to be willing to trade on this timescale. They would also have to be able to adjust their production or consumption at any time and at short notice to absorb any credible imbalance. In the current state of the technology, it is difficult to conceive a system capable of transmitting the vast amounts of data required and of recording the thousands of transactions involved. Even if such an information infrastructure could be put in place, it remains to be proven that such a system would be sufficiently fast and reliable to prevent imbalances that might lead to a collapse of the entire power system. Finally, the transaction costs associated with such a system would be prohibitive." Kirschen, 51
Frequency and voltage regulation
- The Wikipedia page on Utility frequency has some great coverage of why specific grid voltages and frequencies were chosen
- North America is typically on a 60Hz/110V system; Europe is typically 50Hz/230V. Other places vary, and there doesn't seem to be a significant advantage of one vs. the other (as long as it's consistent)
- Frequency and voltage need to be adjusted in real time – here's a graph from National Grid in the UK and a map of changing frequencies as measured by the public in North America
- Equipment designed for a specific frequency can easily break if subjected to even a few minutes of out-of-phase work. A 60 Hz steam turbine may crack if 0.05 Hz off of 60 for a few minutes. Fully loaded, a 60 Hz steam turbine can survive 58 Hz for a total of 10 minutes over its operational lifetime. Graves, 3-15
- Hiskens is an excellent engineering information source for how frequency is kept within bounds on the grid
Automatic generation control (AGC)
- AGC: Automatic Generation Control. An engineered feedback system which uses telemetry from transmission lines to make small adjustments to energy input to the prime mover (e.g. moderating steam injection to the turbine) to keep frequency steady Graves, 3-2
- AGC is a system feedback mechanism that automatically detects small load variations and redistributes the burden of power generation between available generators to keep frequency close to standard Graves, 1-5
- Two key indicators of system status are used in AGC: system frequency and tie-in flows Graves, 3-15
- Before AGC, one generator in a system would be designated the regulating unit and manually adjusted to match load, the rest of the units would match from speed droop
- Droop is settable; it's a way to optimize which generators respond first to changes in the load Graves, 3-16
- Power generation systems don't all produce at the same price– ideally AGC would select for power to be produced for minimal cost, but this is not always physically feasible (it could overload a plant's ability to maintain frequency or a section of transmission infrastructure). Power route through lines also impacts line loss, creating a complex economic tradeoff Graves, 1-5
- Some utilities use OPF (optimum power flow simulations) to determine changing rules for AGC Graves, 1-5
- Transmission line operators have been using computational modeling to determine which generators to spin up to match load and to account for contingency scenarios since at least 1995 Graves, 1-5
Optimal power flow (OPF)
- Optimal power flow modeling is a nonlinear, objective-based optimization problem. A common objective is to minimize short-term costs for power delivery while operating within physical system constraints. Outputs typically include: recommended power production per generating unit, line flows, identification of constraining factors, and marginal cost of operation at various points in the system Graves, 5-1
- OPF is a static analysis and so real-life changes in flow/availability/etc. can drastically alter what is "optimal" post-OPF simulation
Load following
- Generation facilities are classified based on how quickly they can be dispatched. Table of classifications, info from Hug, 5-6:
| Classification | Operational time (h/a) | Generator types |
|---|---|---|
| Peak load units | 1000-2000 | Hydropower with storage (large static head); Pumped storage hydro; Gas turbine |
| Intermediate load units | 3000-4000 | Fossil fuel thermal; Biomass thermal |
| Base load units | 5000-6000 | Run of the river hydropower; Nuclear |
- Trends in when energy demand is high/low in the United States:
 Hiskens, 5
 - Typical trends (though they can vary by geography): consumption is high at noon and in the evening, low at night; weekdays have higher consumption than weekends, but holidays can be either higher or lower depending on season; depending on climate, seasons have different consumption patterns– warm regions have high AC use while cold regions have high heater use Hug, 14-16
- Hydropower stations (especially with large static head) are easy to moderate as necessary; thermal plants are harder/more expensive to moderate quickly, so are more often used for baseload coverage. Steam turbines are hardest to load/unload; gas turbines can help some with load following Hug, 3
- In order to minimize cost (including startup/shutdown transition costs), nuclear and run of river hydro are used all year; controlled hydro is deployed as often as needed up to capacity; thermal power is used to support longer periods of high load; hydropower reserves and gas turbines are used infrequently to support peaks [Hug, 6]
Organization
- NERC is a nonprofit corporation designed to ensure reliability of the North American grid system. Key concepts: Continuously balance power generation and demand; Maintain voltages through balancing of reactive power supply; Keep transmission stable/within technically advisable limits (e.g. not overheating); Operate the system so it is reliable even in the case of an unexpected disruption; Plan, design, and maintain the system; Prepare for emergencies Hug, 10
How the American energy grid works
- Current grid paradigm:
 Hiskens, 4
 - Current American grids: Texas (ERCOT), East, and West. They are separately managed. Chabot
- Transmission systems mostly take place through organized markets (ISO's/RTO's). Other agreements are often called bilateral (2-way agreement between energy supplier and distributor) Caspary, 13
- An excellent introduction to terms and organization of the electric grid can be found in Caspary
- FERC is officially voluntary, 1/3 of US transmission is outside of FERC and RTO's (mostly Texas) Caspary, 7-8
Changing role of the utility
- Utilities in America have traditionally been vertically integrated, fulfilling all of generation, transmission, distribution, demand management & customer service, and optimization. Policy supports the monopoly while regulating the price to support social objectives [Aggarwal, 11][Aggarwal]
- A "restructured" electricity market places the utility in the role of packaging and reselling the individual components of electricity market needs (power generation from independent generators, etc.) to end-use customers [Aggarwal, 11][Aggarwal]
- "Smart integrator" utilities are between vertically integrated & restructured– they may maintain e.g. transmission in-house while sourcing other system components from independent entities [Aggarwal, 11][Aggarwal]
Utility-controlled vs. non-utility generation
- Historically, utilities typically aimed to self-supply, and would import energy from other utilities only in times of system stress (plant outage, very high demand). By the 1980s, due to decreased grid balance, it became more common for utilities with high reserves to sell to neighboring utilities and overall increase in wheeling Graves, 1-2
- Wheeling increases quantity of reactive power needed Graves, 1-3
- Non-utility generators (NUGs) are a substantial and growing segment of electrical energy generation for the grid Graves, 1-1
- Use of NUGs allows utilities to add new capacity without large capital expenditures, but decreases flexibility of the power supply– NUGs often cannot provide spinning reserve or frequency or voltage control Graves, 1-2
Changing the system
- It takes ~10 years (software) ~18 years (hardware) to go from research, through development and demonstration, then regulation, to roll out new operational technology to the grid. It's a waterfall-style development structure of sequential operations. More than Smart, 15
- In the mid-1980s, cost of new high-voltage lines was $125,000-750,000/mile Graves, 1-1
- Transmission capacity expansion can be the addition of new lines, but it can also be the addition of capacitors to smooth out congestion or of devices that redirect flow Graves, 1-4
- In utility-scale planning, "short-term" problems use time horizons of a day to a week. Major short-term problems: unit power commitments, coordination of different types of power generation, reduction of transition costs by balancing when a thermal plant becomes a spinning reserve (using fuel without contributing useful power to the grid) vs. is shut down to be restarted much later. Seasonal planning problems: maintenance scheduling for large generating units, involving shifting of a large load to many less-economical smaller plants while the usual plant is shut down. "Annual" problems span a 1-3 year time horizon: operational budgeting, fuel procurement and inventory planning, maintenance scheduling, design and pricing of utility services. Production costing model is a key tool for annual planning Graves, 1-6
- Utility prices are typically set for 1-3 year periods Graves, 1-7
- Capacity expansion plans have ~40-year time horizons Graves, 1-8
Planning timeframes, copied from Graves, 1-8 - 1-9
| Time Frame | Planning and control problems | Transmission considerations | Planning topics |
|---|---|---|---|
| Real time (seconds to minutes) | Preserving system security while meeting continuously varying demands economically; Maintaining frequency and voltage very near to standards; Anticipating and preventing disruptions to the system | Line electrical characteristics, thermal and voltage limits; Network-constrained dispatch; Flow capacity reserves for contingencies | AGC; OPF; Load-flow sensitivities and distribution factors |
| Short term (a few hours to a week) | Unit commitment tradeoff between transition costs and operating costs | Transmission bottlenecks that affect location and sizing of spinning reserves | Dynamic programming (DP) |
| Annual (1-3 years) | Production budgeting, e.g. for fuel procurement; Maintenance scheduling; Payment rate design | Must-run plants, line losses; Marginal costs of wheeling or providing reactive power; Fixed cost recovery | Production costing; OPF; Cost of service, pricing theory |
| Multi-year (3-40 years) | Power supply planning and NUG bidding; Network expansion for growth and reliability; Long-term wheeling contracts; Open-access regulatory policies | Transmission construction costs and siting constraints; Location-based siting penalties for new generation based on impacts on transmission; Protocols and prices for transmission | Mixed integer programming; PVRR; OPF; Security studies; Financial analyses, LRACs |
Transition in major energy sources
- Energy transitions are slow by nature. Oil took 50 years to climb from first commercial production to a 10% market share, and we continue to depend on prior dominant energy forms: coal, wood Smil, 138
- Quick energy transitions destabilize economies. Any new technology adoption requires a heavy up-front investment (estimated by Smil at at least $3 trillion). This is needed both in the energy sourcing and transport infrastructures, and in the “primary movers”, the major users of the new energy (such as cars). Primary movers take years to become efficient Smil, 138.
- Quick changes in primary energy sources leaves less time to build infrastructure and primary movers. Transition also requires people who had invested in the old system to write off of that infrastructure investment Smil, 142
- From data up to 2008, we are not currently transitioning off of oil. In 2008, energy from new renewable energy sources was less than 2.4% in the United States. Smil, 135
Distributed Energy Resources (DER)
- What is DER and how does it work, from CAISO: https://www.caiso.com/Documents/InterconnectionOptionsBasics.pdf
- The current power grid is not set up to support distributed power; it works through a few sources providing great amounts of energy. Victor
- 2014 report makes careful distinction between the many, many DER connected to the grid but not integrated with the grid – a situation which can cause grid instability if not corrected EPRI, 7
- Grid and DER can be complementary, several reports stress that they should not be phrased as 'in competition'. DER can efficiently supply the grid with (in aggregate) a stable, cost-effective power source. Grid is a distribution and storage mechanism that can ensure reliability of energy delivery by intelligently routing supplies to demands EPRI, 7
- Power transmission lines are expensive and inefficient - local solar & wind reduces cost and energy production need Lovins, 72
In California
- California is generally considered the pilot/leader for the United States on DER
- Vision for DER in California:
 More than Smart, 17
 - There is an effort underway to better integrate DER within CAISO. Guiding principles include work to evolve the grid to an open network platform that is based on energy nodes with high transparency and resiliency. Pieces of the strategy include flexible technologies that should be able to interoperate with future unforeseen innovations and better align timing of power resources with customer needs. More than Smart, 16
- P-nodes, or pricing nodes, are a pricing structure for distributed energy resources. Essentially, a price is set by balancing the supply and demand at each point where two wires cross. As of 2015, there were 4,900 of these in California. StJohn
In Germany
- Germany's DER adoption was spurred in part by EEG but didn't pre-plan to integrate the new distributed resources with the grid– so they have been learning how to integrate the existing already-connected resources EPRI, 12
- In initial rollout, PV generators were not required to respond to grid operating requirements or support the grid (with e.g. frequency control or demand response) EPRI, 13
[aggarwal]: https://www.sciencedirect.com/science/article/pii/S1040619013001917 "Aggarwal, Sonia and Harvey, Hal. 'Rethinking Energy Policy to Deliver a Clean Energy Future.' Energy Innovation, 2013."
[trabish-dynamic]: https://www.utilitydive.com/news/beyond-tou-is-more-dynamic-pricing-the-future-of-rate-design/447171/ "Trabish, Herman. 'Beyond ToU: Is more dynamic pricing the future of rate design?' Utility Dive, 2017."